01
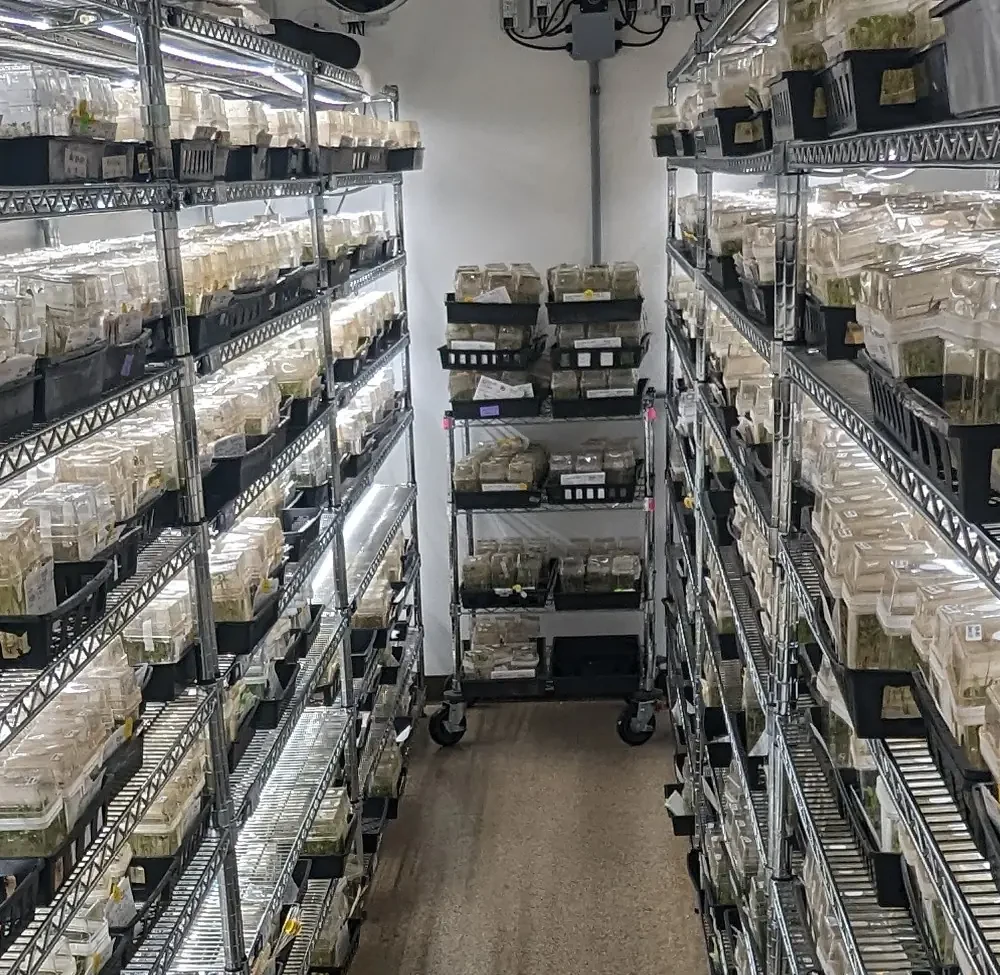
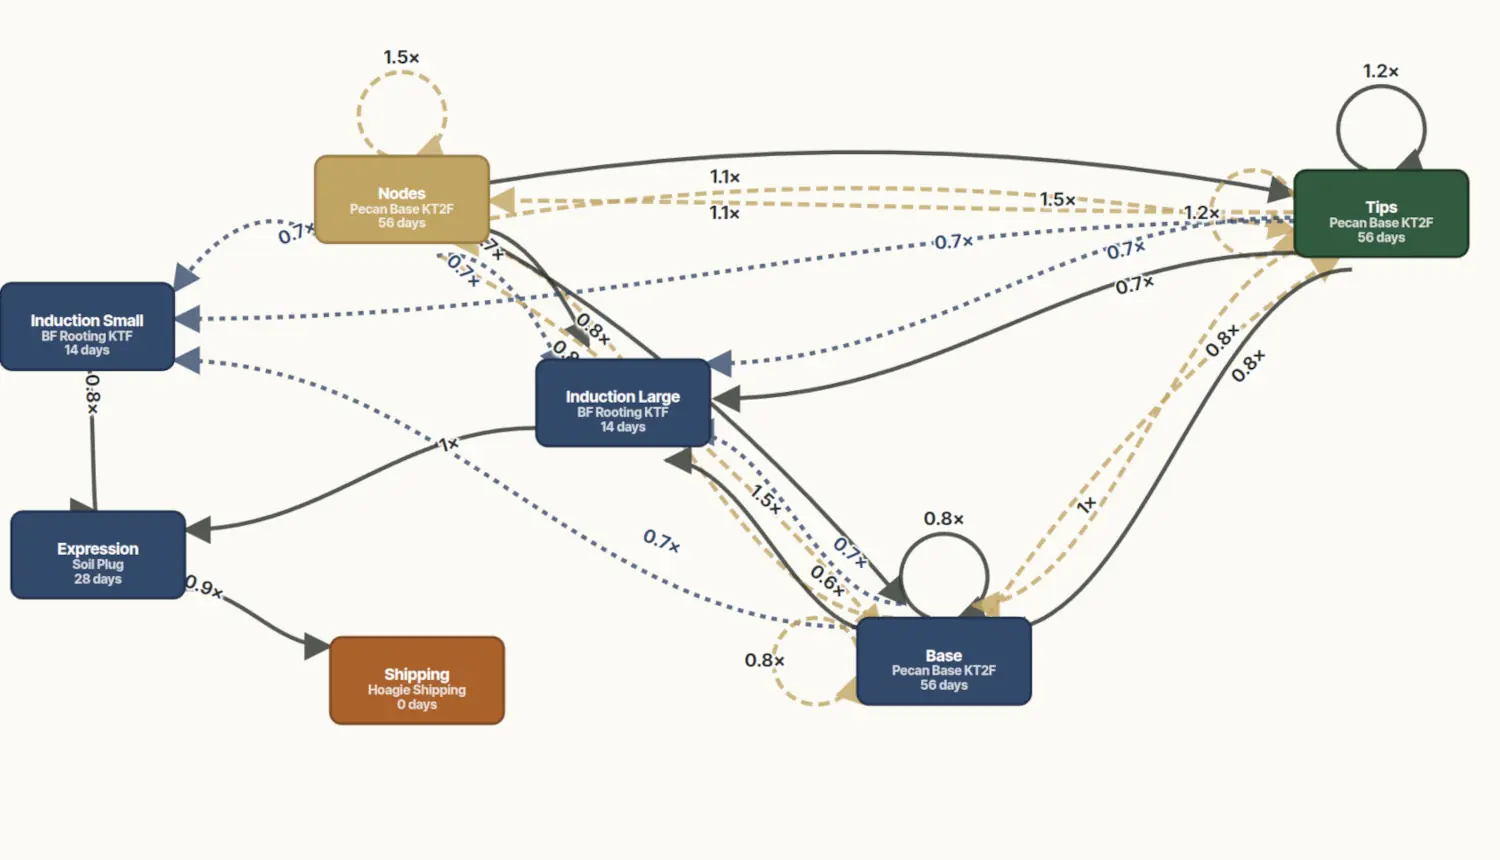
Your lab as a network.
Define how material flows through your operation: multiplication loops that return cultures to the bench, steady-state pathways that hold a population at the right level, routing rules for everywhere in between. The network is the model the platform uses to schedule, route, and predict.
02
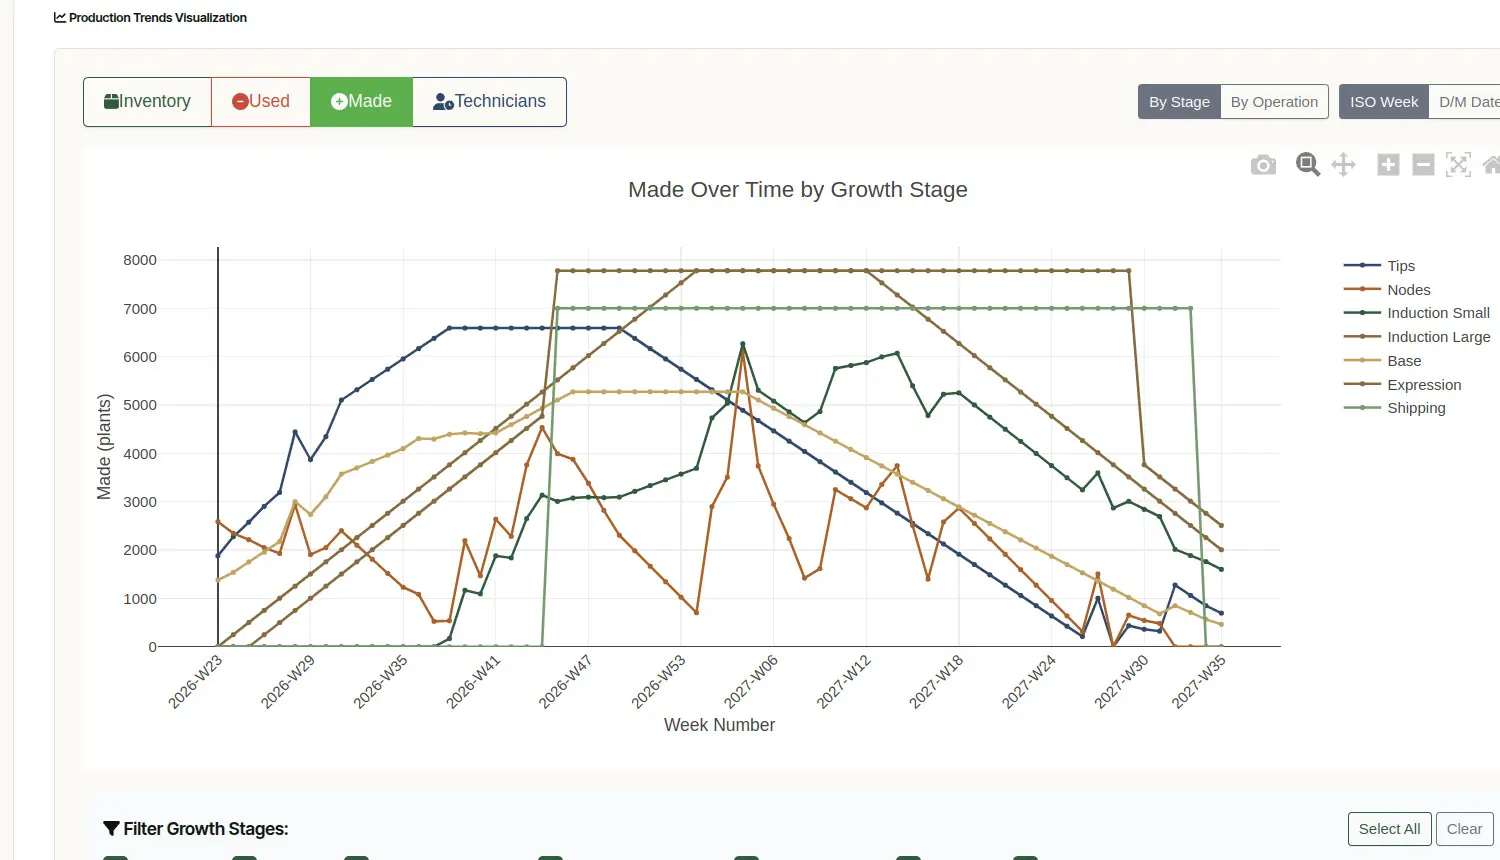
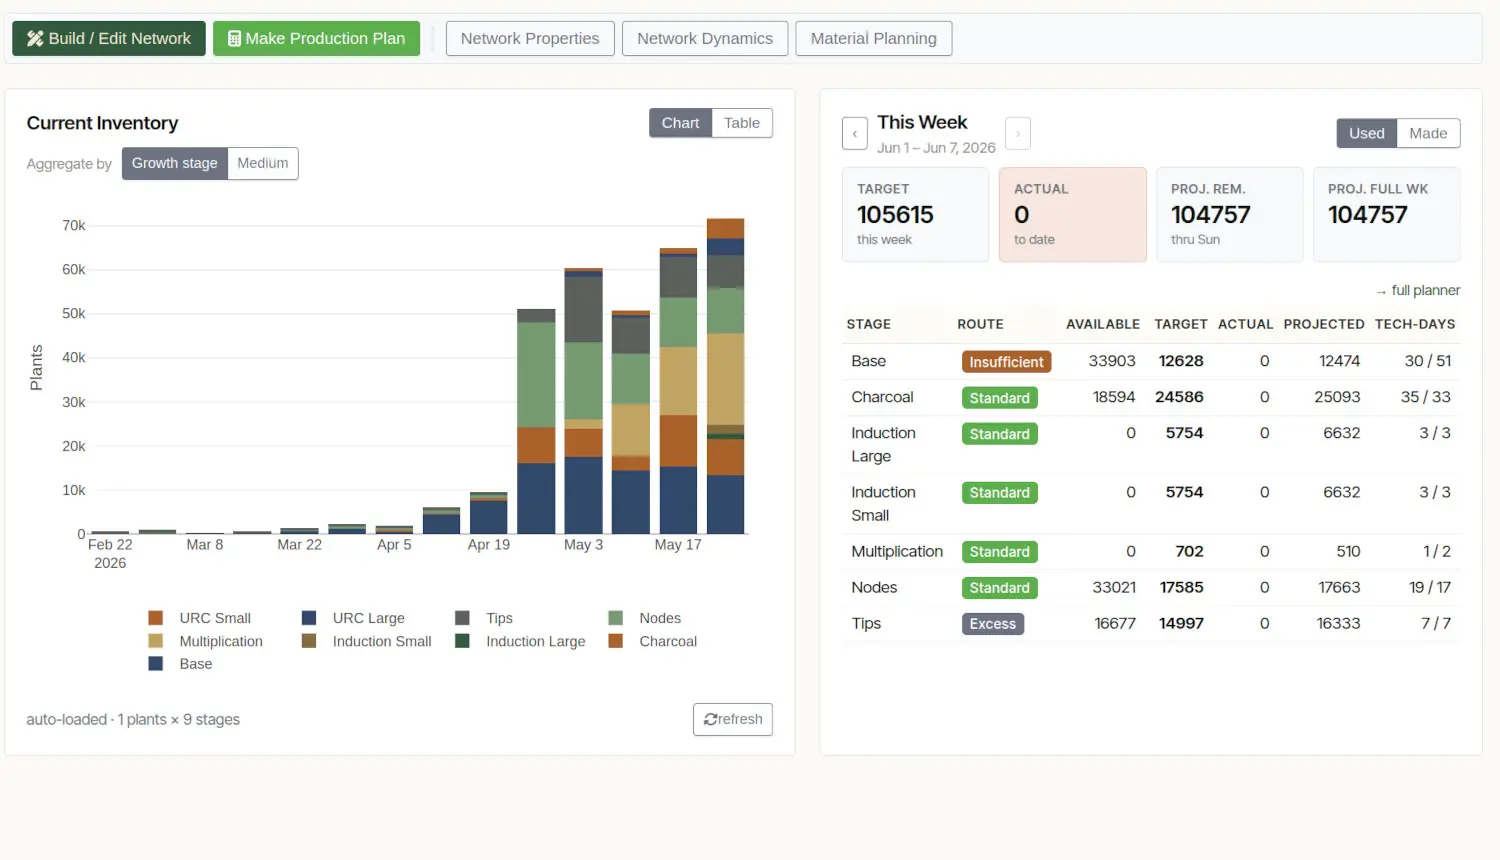
Schedule from delivery dates back.
Set the dates when material has to ship. The production planner works backward from those commitments and figures out what each week between now and your delivery dates needs to look like to make them. Throughput targets, container counts, labor curves — all derived from your own model, not guessed.
03
Auto-assign techs to weekly targets.
Once the week's targets are set, the assignment tool maps each hood tech to the stages they should work on and the lots they should touch. The work board on Monday morning reflects what the production planner determined needs to happen for the week to land on target.
04
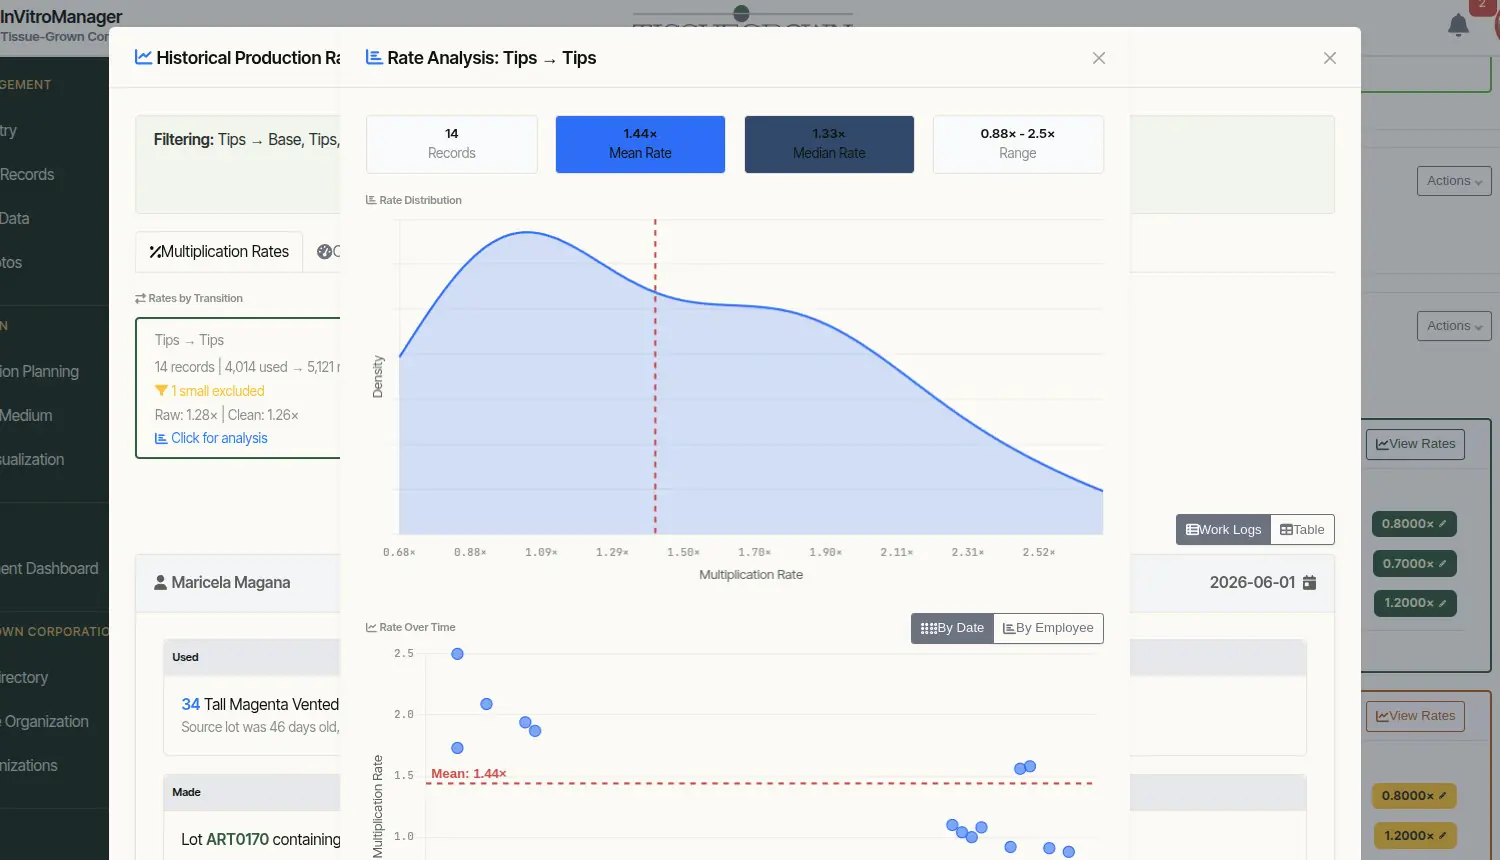
Real multiplication rates, not industry averages.
Every week the platform recomputes your actual multiplication rates from real operator data — by stage, by line, by tech. The schedule is anchored to those numbers, not assumptions from a textbook or a previous job.
05
Bottlenecks, before they bite.
Equilibrium analysis surfaces the stages where your operation will run out of capacity weeks before the bench notices. Plan, hire, or shift work to flatten the curve before the bench gets bottlenecked.
06
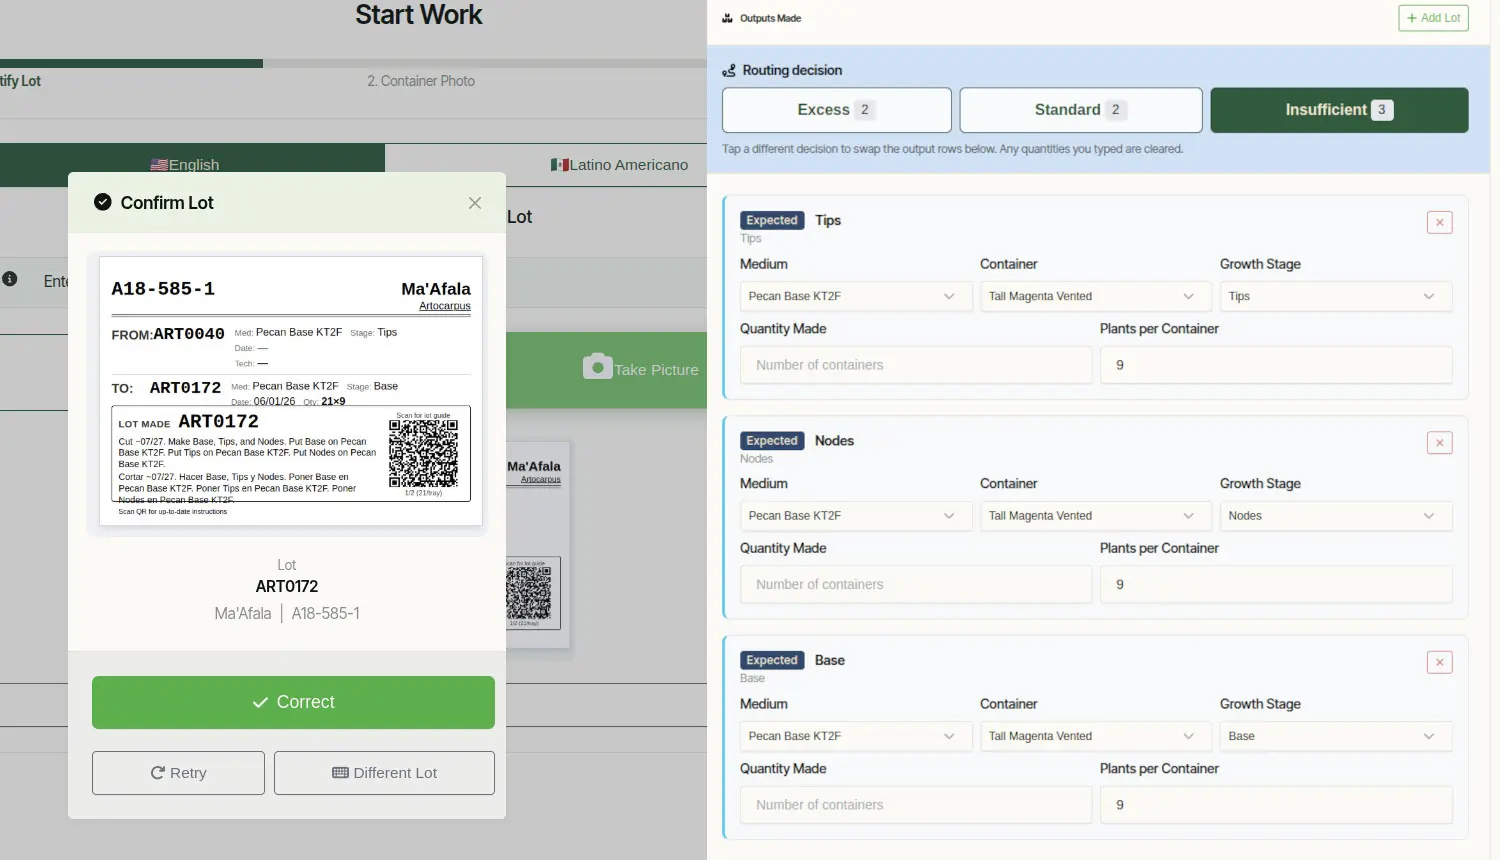
Data entry, reduced to confirmation.
When the system already knows what's supposed to happen at each stage this week, work logs become a confirmation rather than a description. Techs record what actually changed, not what they did — and the schedule stays in sync with reality.