A customer calls in October. The 2,400 plants of cultivar X you shipped them in March rooted at roughly half the rate of the lots you sent them a few months earlier. They want to know whether something was different about the material that left your lab — whether this is on you. It's equally possible that something changed on their end: a different greenhouse, a new substrate, a hotter spring. The only way to answer the question honestly, to them and to yourself, is to compare those March lots to the ones that rooted normally — which means knowing which medium batch each grew on, which growth stages they passed through and when, who did the work, what they looked like at week four, and which mother accession they trace back to. If any one of those facts is missing, the answer is "we don't know." If they all exist but live in five different notebooks and three spreadsheets, the answer is "we'll get back to you next week" — and you probably won't.
Every commercial tissue culture lab has a version of this story. The fix isn't more rigorous notebooks. It's a clear answer to two structural questions: what fields belong on every work event, and what entities those events need to point at.
The nine fields every work event should carry
A work event is anything a technician does to a lot — subculture, transfer, contamination discard, shipment. Each one mutates the lot, and each one is where data either gets captured or quietly evaporates. Nine fields should be on the form, every time, with no "optional" and no free-text substitutions for things that should be picklists.
| Field | What you capture | Why it earns the line |
|---|---|---|
| Date | Calendar date, ideally time | Time-series anything: trend detection, audit trails, "when did this start?" |
| Operator | The technician who performed the work | Skill curves, training feedback, contamination correlations by hood and tech |
| Operation time | Total time the event took (e.g., 4h 0m) | Operator skill comparisons, per-plant cost accounting, and labor-requirement forecasting |
| Growth stage | Stage of the lot at the time of work | A tip, a node section, and a base with formed shoots each grow at different rates — every yield and labor comparison needs the stage to compare like with like |
| Medium | Recipe ID and batch ID — see below | Isolate medium variables when a cohort of lots underperforms |
| Container type | The jar, plug, or tray model — not just "container" | Biology depends on the vessel: root development, gas exchange, density |
| Containers in / out | Counts consumed and counts produced by the event | The substrate for every yield, loss, and multiplication-rate calculation |
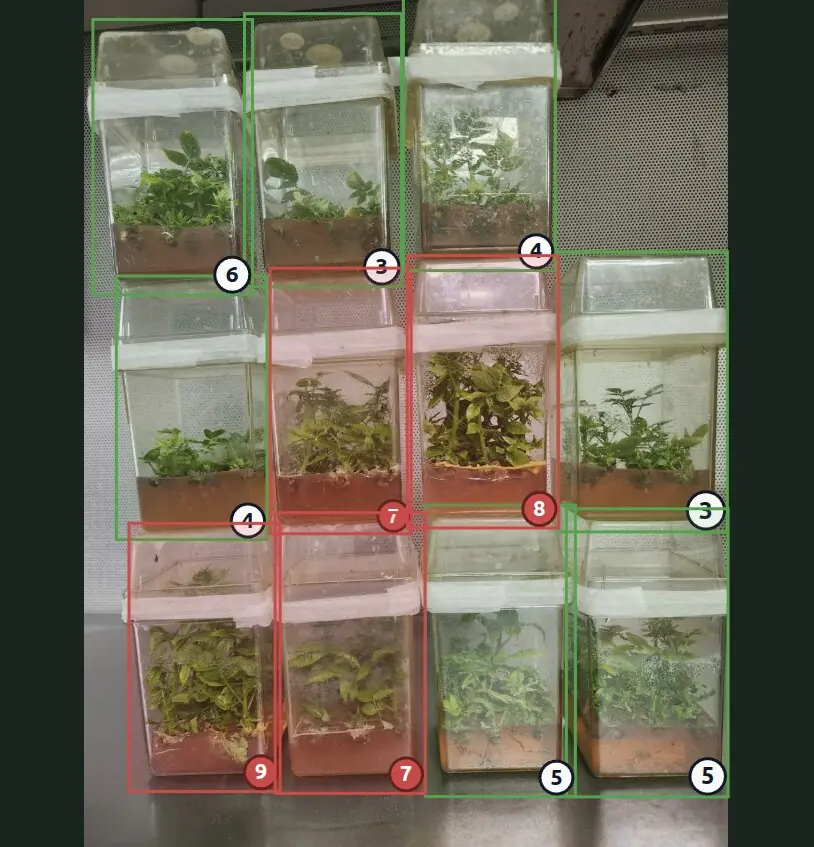
| Plants per container | Per stage, recorded — not assumed | Without this, every container count is ambiguous by a factor of 1×–9× |
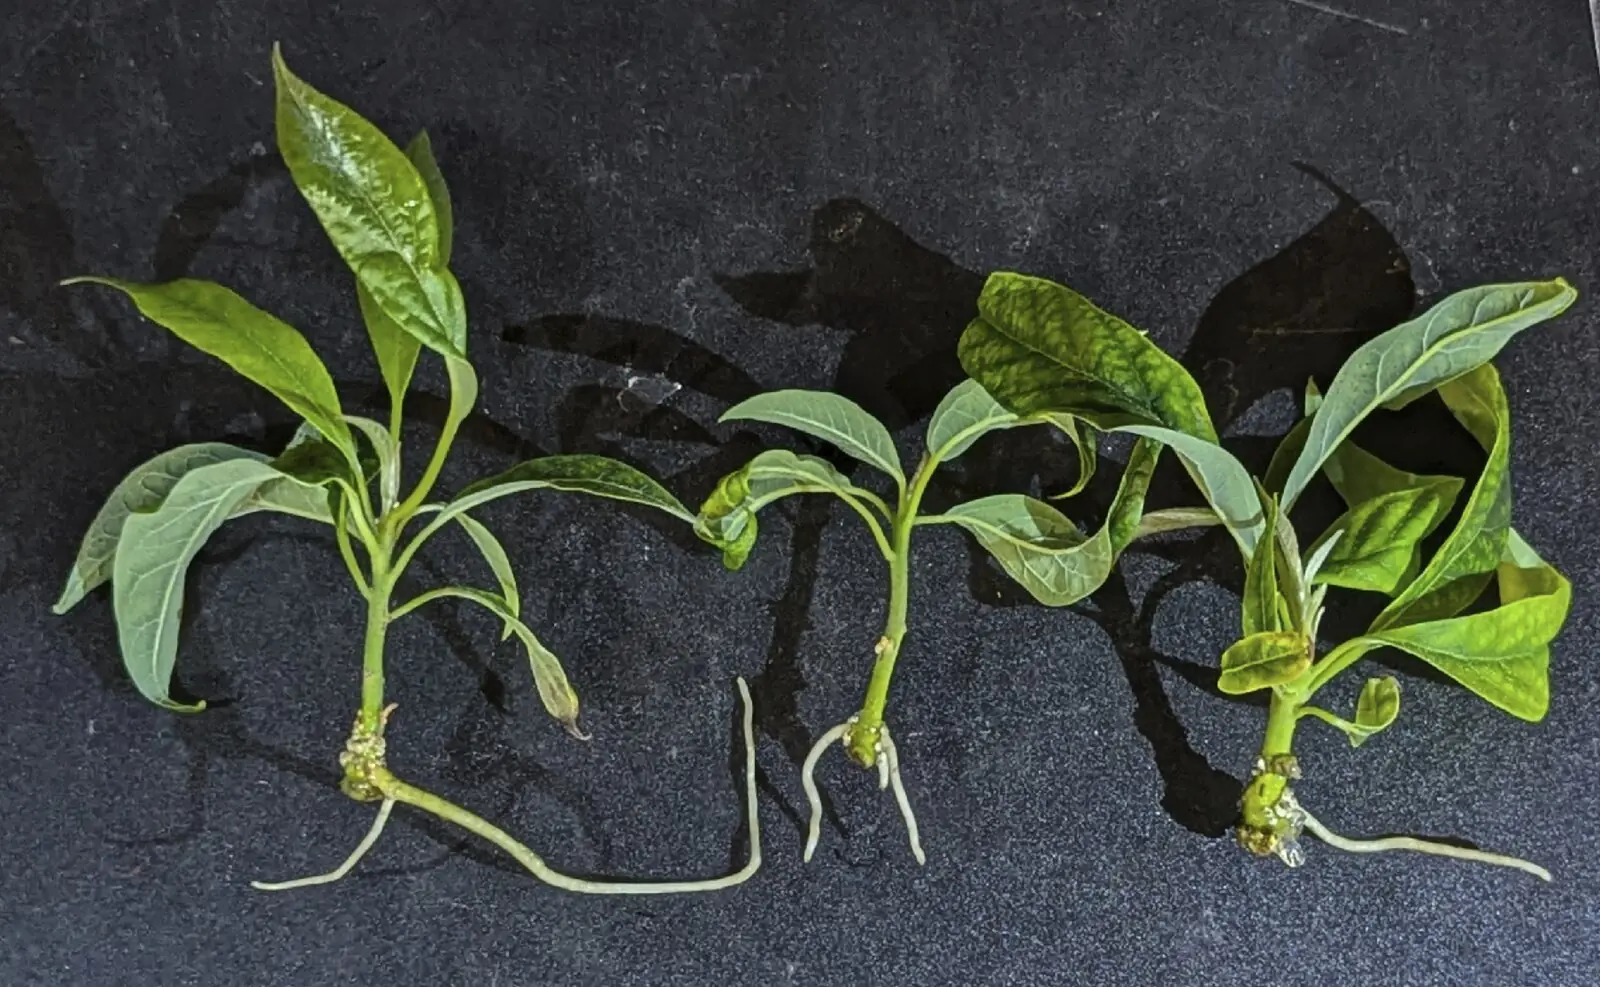
| Photos | One per lot at every work event — ideally one before the cut and one after — label visible, consistent angle | Visible contamination at the moment of work tells you which lots to multiply from next pass; CV models track slow quality drift human eyes miss; customer reports |
But events alone aren't enough
Recording all nine fields on a worksheet that reads "Subculture, 2026-05-26, Maria, 4h 15m, MS-3 batch #214, jar-470, 9 plants/container, 6 in, 48 out, photo attached" is a perfectly disciplined event capture. It is also useless on its own. You can't answer any question about that row until you know which lot it was, what variety the lot contained, and where the plant material came from.
Events are the verbs. Entities are the nouns. Without a noun, no verb means anything. Every event-level field you capture is filed against something — and if that "something" is missing, the field is noise.
Three entity-level fields make work-event data queryable later:
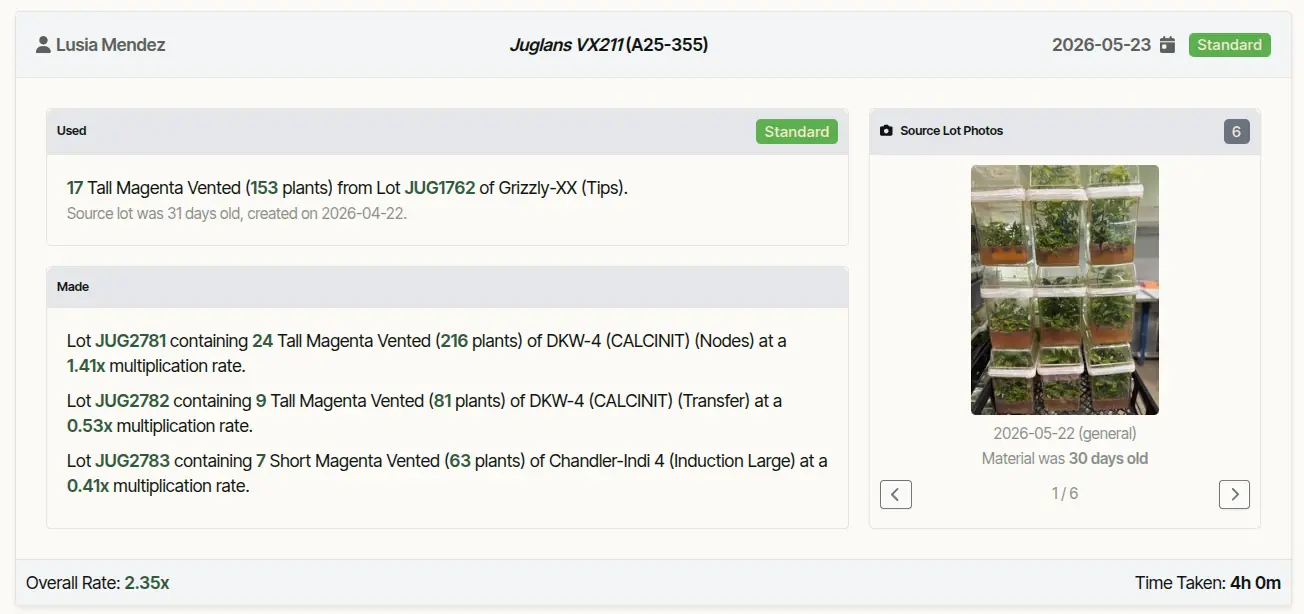
- Lot identifier. Every lot gets a unique ID at the moment it's created, with the date and plant line embedded so it can be read at a glance — something like
2026-05-26-CMX-001for the first lot of cultivar CMX started today. No exceptions, no "we'll add it later." - Plant line / cultivar. What variety is in this lot. This is the field that lets you compare how the same cultivar performed across batches, across techs, and across customers — the join behind every multi-month trend report.
- Source lot. The parent lot this material came from. Six months of these chained together is the genealogy a customer or auditor will eventually ask for, and the only honest answer to "which mother plant?"
The medium is two things, not one
The word "medium" gets used to mean both the recipe (MS basal salts + 1 mg/L BAP + 30 g/L sucrose) and the specific batch that was autoclaved last Thursday by Carlos. These are different facts, and they cause different failures.
Recipe is the formulation — the chemistry on the spec sheet. Batch is the physical jar of medium poured today. Two lots on the same recipe but different batches can grow differently because of pH drift, autoclave variation, or a mislabeled stock solution.
When you only track the recipe and a batch goes bad, every lot that touched it looks like an independent problem. When you track both, the pattern shows up the first time you look at the data sorted by batch number.
Which fields do disproportionate work
All nine fields earn their place, but four of them change what questions you can ask. The rest tell you what happened; these four tell you why.
Growth stage and plants per container, together
These are the unit-conversion fields. The same "60 containers a week" can mean 60 plants or 540 depending on which stage produced it — induction packs 9 plants per jar; shipping is one per cell. Without both fields recorded on the event, every throughput number, every labor-hour calculation, and every multiplication-rate estimate is computed on the wrong denominator.
Multiplication rates are where this bites hardest, because two unrelated things both produce numbers below 1.0. The first is a units bug: the same source-to-target step that reads "1:1" in containers is "9:6" in plants — a 0.67 plant-rate from a 1.0 container-rate, same reality in a different unit. The second isn't a bug at all. In normal lab operations, a single source lot routinely gets cut across multiple destination stages, and weaker plants are culled at advance — both produce per-output rates well below 1.0 that are entirely expected. A subculture that takes 153 source plants and splits them into three child lots at 1.41×, 0.53×, and 0.41× isn't broken; the three rates sum to a 2.35× overall multiplication for the event, and each sub-1.0 number is one branch of a healthy split. The danger is reading any of those numbers without knowing whether it's per-output or overall, and whether it's in plants or in containers. The fix on both counts is the same: record growth stage and plants per container on every event, and label every multiplication rate with its unit and its scope (one output, or summed across siblings).
Operator
The most underused field in the industry. Tagging every event with the technician who performed it gives you skill-curve data on new hires (how long until their contamination rate stabilizes?), a way to find the hood-level pattern in a contamination outbreak, and an honest answer in any audit that asks "who handled this material?" — without anyone having to remember.
Operation time
Pair operation time with the operator field, and three otherwise-impossible questions get one-sentence answers: how much labor does it actually cost to produce a shippable plant of cultivar X? Is the new hire reaching baseline speed yet? Given next quarter's order book, how many tech-hours do we need to schedule? Cost-per-plant accounting, training feedback, and labor forecasting all collapse to easy queries once the field is there — and none of the three is possible without it.
Photos
Regular images of every lot would be ideal — a weekly snapshot would let you measure attrition and contamination between work events. In practice that's an enormous data-collection burden on top of the rest of the lab's work, and most of what those weekly photos would tell you can be captured by photographing each lot at the time it's worked. Ideally twice per event: one photo of the source material before the cut, and one of the plantlets after, so the after photo also confirms the technician advanced the material into the right stage.
That cadence — at every work event, label visible, angle consistent — yields three datasets at once. First, an immediate quality check: the tech sees visible contamination at the moment of work, and the lab uses that signal to prioritize the cleanest lots for the next subculture pass instead of multiplying the marginal ones. Second, a longitudinal record that computer-vision models can act on. A quality model trained on a few thousand labeled images can grade each jar on a numeric scale — vigor, leaf area, color, root development — and produce a per-lot quality trend that humans can't reliably see, because the change between any two consecutive cycles is too small to notice even though six months of those changes add up to a different-looking lot. The same class of model flags suspected contamination on the spot, before a tech cycling through 200 jars has the bandwidth to scrutinize every one individually. Third, customer reports: proof of life on lots already sold. The catch is that all three uses require the photos to be routine and queryable — a folder of 40,000 unlabeled JPEGs is not a photo record.
Why "we wrote it on the worksheet" usually fails
A worksheet captures the event. It does not capture it in a form anyone can query a week from now. The arithmetic of the transcription tax:
A single work event captures around nine hand-keyed values (the photo
doesn't transcribe). At a 1–3% per-field error rate, the probability
that any one event has at least one error is
1 − (1 − rate)⁹ — between 9% and 24%.
Translated: roughly one in eleven to one in four work events
recorded this week carries a silent transcription error somewhere in
it, most undetected until they cause an order to ship wrong
or a contamination event to be miscoded.
The downstream consequence usually isn't a row that's obviously broken — it's a row that quietly looks fine but no longer matches reality. The most expensive version is a line cross: a mistyped lot ID or source-lot reference that makes a child lot appear to descend from the wrong parent — a Juglans line apparently rooted in a Quercus mother, an experimental cultivar showing as a child of the wrong control. A reasonably disciplined data setup will flag line crosses automatically during a sanity check. The trouble is that real line crosses happen too — mis-shelved jars, mislabeled containers, physical contamination — and from the spreadsheet alone there's no way to tell a flagged cross from a paperwork artifact. Each one becomes audit work: interview the tech, look up photos if they exist, sometimes re-genotype the lot. Even at five or ten flagged crosses per month, the hours add up.
In a disciplined six-tech lab running 40–60 work events per week (more than that and the recording overhead becomes the limiting cost), the math lands at roughly 4–15 records carrying a silent error weekly. The volume is modest; the line-cross audit work above is what makes it expensive. Layered on top is reconciliation overhead — the time techs spend resolving "the notebook says X but the spreadsheet says Y" across fragmented records — easily an hour per tech per week, or roughly $9–15k of fully-loaded labor annually for a six-person lab, producing data that won't actually answer the questions you will want to ask of it.
The 1–3% transcription error rate is well-documented across industries that hand-key data — medical records, manufacturing QA, lab data entry — and a tissue culture worksheet is no different. The other three figures are estimates from audit work with commercial labs; the 30%-retrieval number in particular spans a wide range, with some labs closer to 10% and others well above 60%.
What you record at the hood determines what questions you can answer at the desk.
- 500+ fields hand-keyed each week
- 9–24% of events carry a silent error, mostly undetected
- Line-cross flags: hours of audit work to resolve each
- ~1 hour per tech per week reconciling notebooks
- Genealogy questions: days to answer
- Lost worksheets: 2–5% per month, on average
- Same 500+ fields, captured during the work
- Entry-time validation catches 90%+ of malformed entries
- Line-cross flags traceable in under a minute via lot history
- Zero reconciliation time
- Genealogy questions: seconds to answer
- Lost data: only what was never captured at all
A starter checklist you can adopt this week
These are tool-agnostic. None of them require buying software; they work on paper or in a spreadsheet for a six-month proof before you evaluate platforms.
- Every lot gets a unique identifier at creation, with date and plant line in it. No exceptions, no "we'll add it later."
- Every work event references its source lot by that identifier. Genealogy emerges automatically from the chain.
- Every event records all nine fields — date, operator, operation time, stage, medium (recipe + batch), container type, containers in and out, plants per container, and a photo.
- Contamination gets its own short form: what was lost, where, when, by whom. Not a blank line in a notebook.
- Pick one place — one folder, one spreadsheet, one database — and commit to it for 90 days before considering a different tool.
Run those five practices for six months and the October phone call gets a real answer instead of a stall. Maybe it's "Yes — those March lots all grew on MS-3 batch #214, and we saw a pattern with three other lots that week. We switched batches; everything since has rooted normally." Maybe it's "No — those lots looked identical to the February ones at every checkpoint, same medium batch, same techs, same source accessions. Something changed on your end." Either answer is honest, and either answer ends the conversation. The one you can't afford is "we don't know." Avoiding it doesn't require any particular software — it requires that the nine event fields and three entity fields were both captured, on every record, in one place you can actually search.